Introduction
The project deals with coming up with a location for a person to start a new food business in the city of Bengaluru, India. We will use the APIs provided by OpenCage and Foursquare to access the venues in the city. The neighbourhoods of the city have been collected from the csv file from kaggle.
We will use the visualization provided by Folium to visualize the data on the map of Bengaluru.
Extracting Data & Cleaning Up!
The data for this project is taken from Kaggle. On closer observation, data had few outliers in them. Those outliers were removed from the data using pandas. The data that we have loaded into the project contains geographical coordinates of the different neighborhoods inside Bengaluru, Longitude and Latitude values to be precise. Based on these values we will be able to load them on a map using Folium Library.
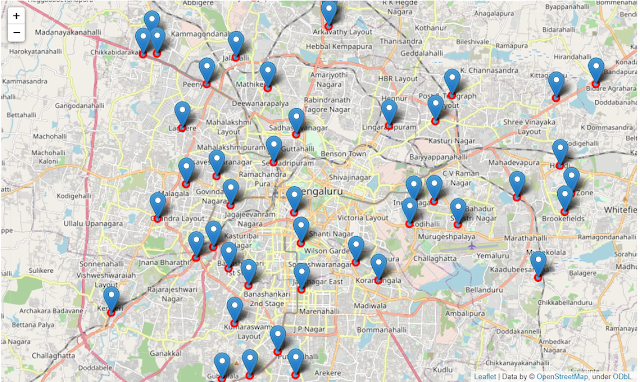
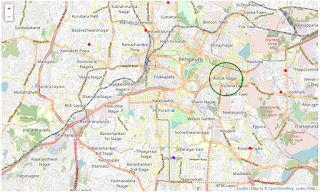
But first we will use Geolocator to give us the coordinates of Bengaluru and create the map of the city.

Now that we have the map generated, we will run our neighborhoods through the map and visualize them as markers on the map.
Now we will proceed to Foursquare API and explore the neighborhoods of Bengaluru.
This is the head of the dataframe generated.

Once the dataframe was generated from Foursquare we use the count function to determine which neighborhoods have the most number of venues. From our dataframe, it was noticed the most number of venues were in Koramangala. The count was 78. Using the unique function we found out that there were 123 unique venue categories.
Problem Solving Methodology
With the help of Foursquare API, we have found out the most popular venues in each of the neighborhoods that we have entered. 464 venues were obtained and out of which 123 are unique. For this project we are looking for the best neighborhood to start a new business, so we'll go ahead and remove the neighborhoods with fewer venues. This is done so as to add strength to our analysis.
Interpretation
We will start off by plotting the number of venues each of our considered neighborhoods have.
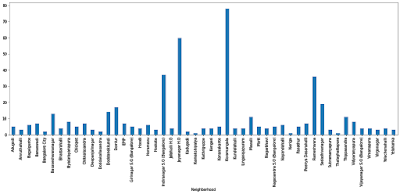
Based on the visual representation that we have for the neighborhoods, we will go ahead and trim our neighborhood set to sets that have over 10 venues. The rest will be removed.

We will then find out the venues that each of the neighborhoods have and the count of them.
We then created a data frame and displayed the top 10 venues for each neighborhood.

We will then go ahead and create clusters for the neighborhoods. In this case, I have used the Elbow method to identify the optimal value for k.

With the help of Elbow method, we have our k as 4. We will use this to divide the neighborhoods into clusters.
We will now go ahead and visualize the venue density of each cluster.

We can see that cluster 0 is the most dense cluster.
We can find the most suitable location to start a new business by finding the centroid of the cluster.
Based on our analysis we found the centroid coordinates to be [ 12.968938795,
77.6096342896932].
We can check which neighborhood these coordinates belong to by running them through the OpenCageGeocode.
Results
Based on the analysis on the dataframe that we had created, we have come to the conclusion that The Best Neighbourhood to start a New Business is in: 'GUHPS Ashok Nagar, Markham Road, Ashok Nagar, Bengaluru.
Discussion
We can now check the breakdown of each cluster that we had analysed and see if we can find anything new which may benefit in the business.
We will plot our clusters and see the distribution of the venue categories across the clusters
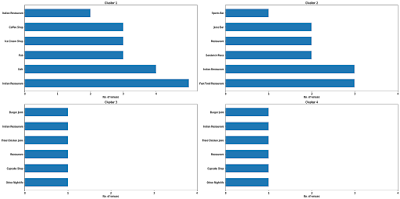
Based on the above plot it is safe to say that most common venues are Indian Restaurant and Cafe.
There is a scope of creating new businesses in clusters 3 & 4 as the number of venues are only 1 in those clusters, which means that the customers in those clusters don't have enough choice when choosing a particular venue.
Conclusion
Our Objective was to analyze the neighborhoods of Bengaluru and create a clustering model to suggest suitable places to start a new business based on the category. The neighborhood's datasource was a file from Kaggle which was then cleaned up to remove outliers. We used Foursquare API to find the major venues of each neighborhood. We limited our neighborhood set based on the number of venues . We interpreted our optimal k by using the Elbow method.
We found out that the best neighbourhood to start a new Business is in the GUHPS Ashok Nagar, Markham Road, Ashok Nagar, Bengaluru. The biggest drawback of this project is that we have correct coordinates of very few venues for the neighborhoods. If a better data source can be found, a better analysis of the neighborhoods can be done.
Comments
Post a Comment